Case Studies
Real Accounts. Real Screenshots. Real Results.
Every number below is pulled directly from Amazon Seller Central or our reporting tools. Unedited proof.
The Ads Were Fine. The Listing Was the Problem.
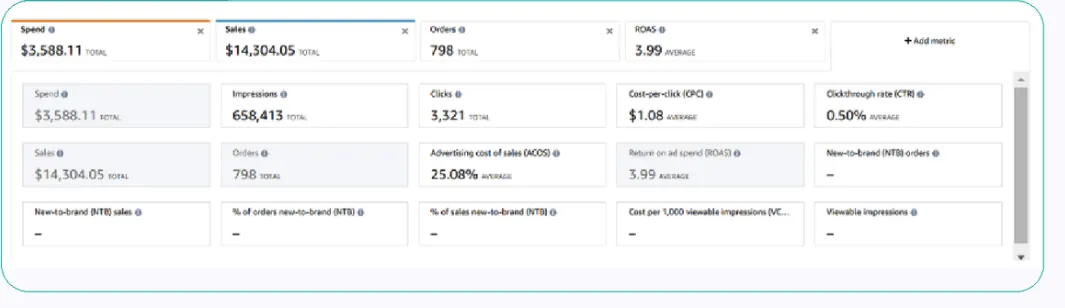
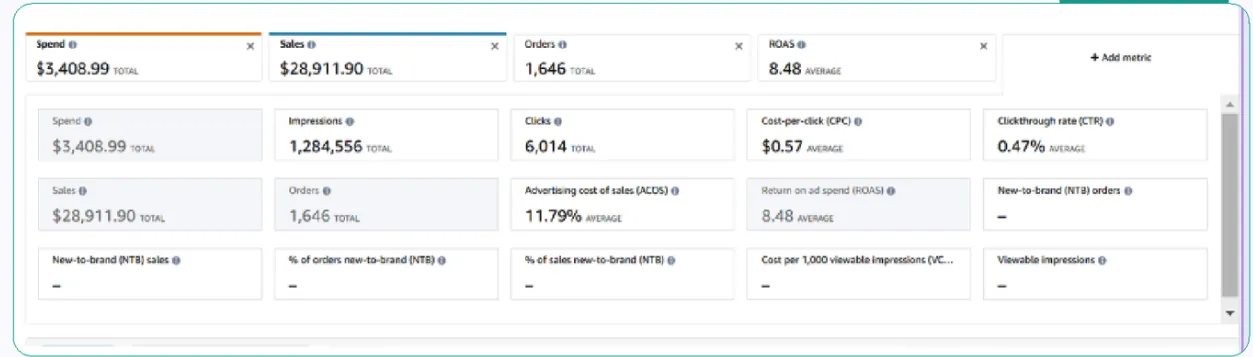
This account was running ads on a product that wasn't ready to be advertised. The main image had low CTR, the copy wasn't telling the right story to the buyer, and there was no A+ content to close the sale. Pouring more budget into a listing that couldn't convert was never going to work. The 25% ACOS proved it.
Ad Sales
$14,304
↓
$28,911
+102%
BEFOREAmazon Advertising Console
AFTERAmazon Advertising Console
They Wanted to Scale. Every Time They Did, ACOS Spiked.
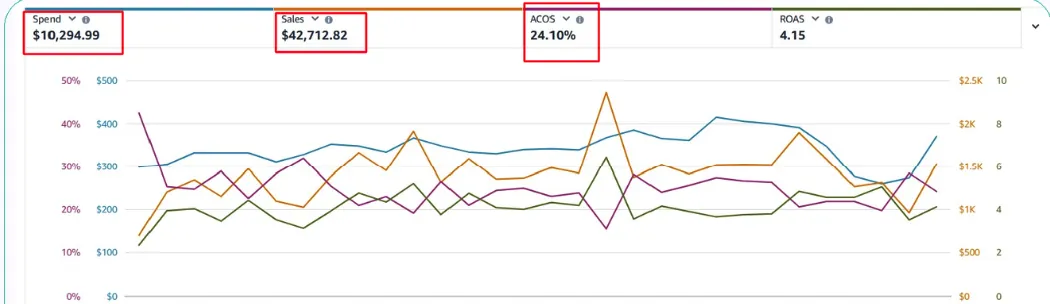
The account was active and spending, but the performance graph told the real story. Volatile swings, inconsistent ACOS, and no reliable system behind the campaigns. Every time they pushed more budget in, the returns got worse. The problem wasn't ambition. It was architecture.
Ad Sales
$19,680
↓
$42,712
+117%
Ad Spend
$6,697
↓
$10,294
+54%
BEFOREAmazon Campaign Manager

AFTERAmazon Campaign Manager
One Month In. Sales Up 126%. ACOS Nearly Halved.
November's numbers told a familiar story: an account running on autopilot. ACOS was spiking to unpredictable highs, daily performance swung wildly, and nobody was steering. The brand was spending real money with no real system behind it. When we took over, we moved fast, tightened the listing story, rewrote underperforming copy, and restructured campaigns within the first week. December told a different story entirely.
Ad Sales
$15,170
↓
$34,257
+126%
Ad Spend
$4,193
↓
$5,702
+36%
BEFOREAmazon Campaign Manager: Nov vs Dec
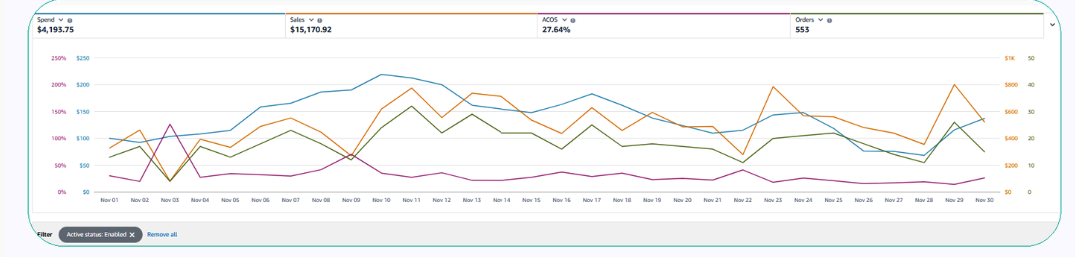
AFTERAmazon Campaign Manager: Nov vs Dec

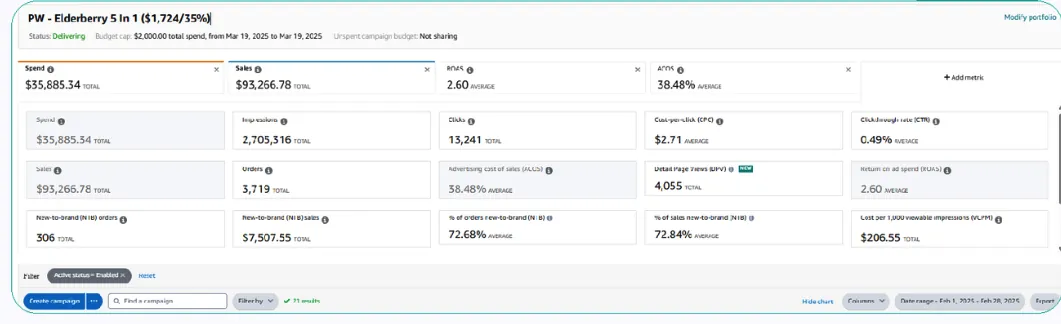
The Goal Wasn't Better ROAS. It Was Bigger Numbers at the Same ROAS.
This brand already had a profitable product and healthy ad economics. They didn't need us to fix efficiency. They needed to scale fast without breaking what was already working. Their ask was clear: grow the volume, hold the ratios. Most agencies get one of those right. We had to deliver both.
Ad Sales
$38,207
↓
$93,266
+144%
Ad Spend
$14,975
↓
$35,885
+140%
BEFOREAmazon Campaign Manager
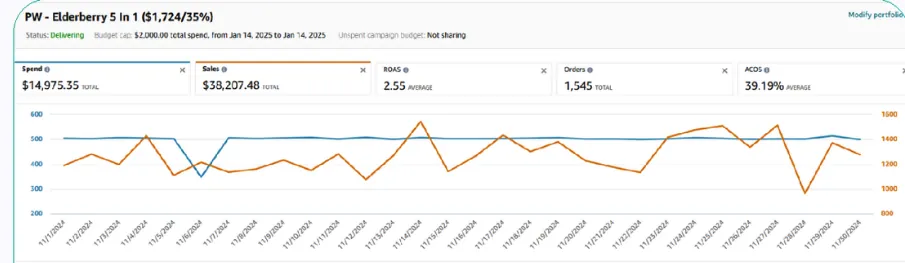
AFTERAmazon Campaign Manager
Searches Were Falling. Their Keyword Clicks Doubled Anyway.
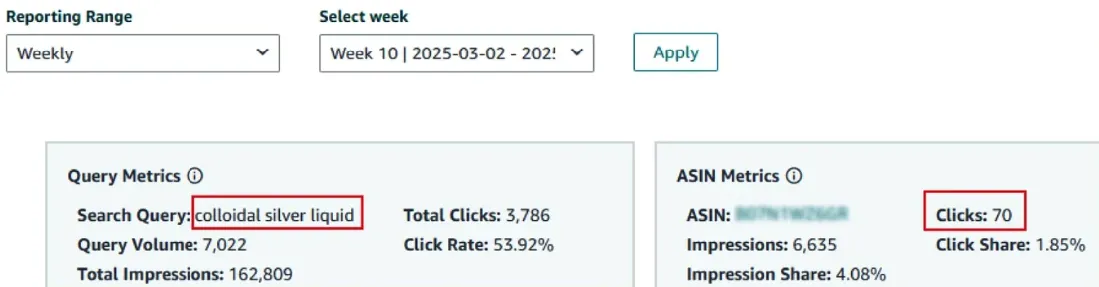
A smaller brand with a specific goal: rank higher and get more clicks on their most important keyword, colloidal silver liquid. The challenge was that total search activity for this keyword was actually declining during the period: fewer searches, fewer impressions, fewer total clicks on the query. This brand still grew, and the reason came down to one thing: the main image.
Brand Click Share
0.85%
↓
1.85%
+118%
ASIN Impressions
4,353
↓
6,635
+52%
Brand Impression Share
2.53%
↓
4.08%
+61%
Total Query Clicks
4,018
↓
3,786
↓ −5.8%
BEFOREAmazon Search Query Performance (SQP)
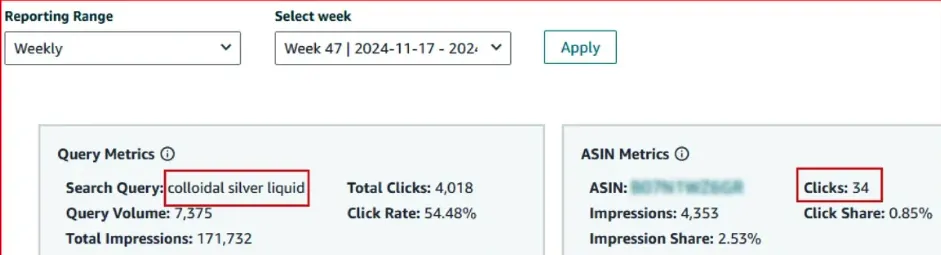
AFTERAmazon Search Query Performance (SQP)
Onboarded in June. Hit Their Biggest Month Ever by January.
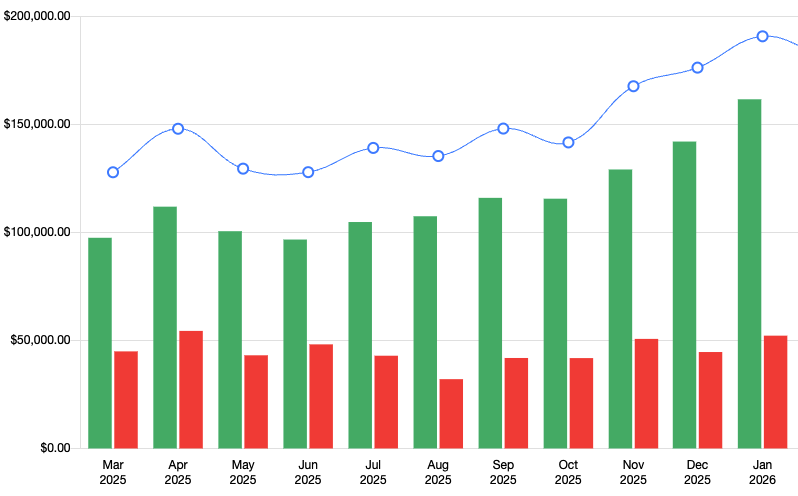
This store wasn't broken. It was stuck. Revenue was holding around $97-110K per month but going nowhere, with no clear upward direction month to month. When we took over in June 2025, the goal wasn't to fix one thing. It was to build a system that compounded. Seven months later, January 2026 became their highest revenue month on record.
Revenue at Onboarding
~$97K
↓
~$160K
+65%
Performance Index
~$128K
↓
~$190K
+49%
Monthly Direction
Flat / Erratic
↓
Consistent ↑
MoM ↑
Months to Record High
0
↓
7 months
Jun→Jan
Account Milestone
Plateau
↓
Best Month Ever
Record
Real Account Data: Monthly Performance ChartAmazon Seller Central: Mar 2025 to Jan 2026
CommerceKind onboarded June 2025. Consistent month-over-month growth from this point forward.
16 Purchases a Week. Then 161. From One Keyword Alone.
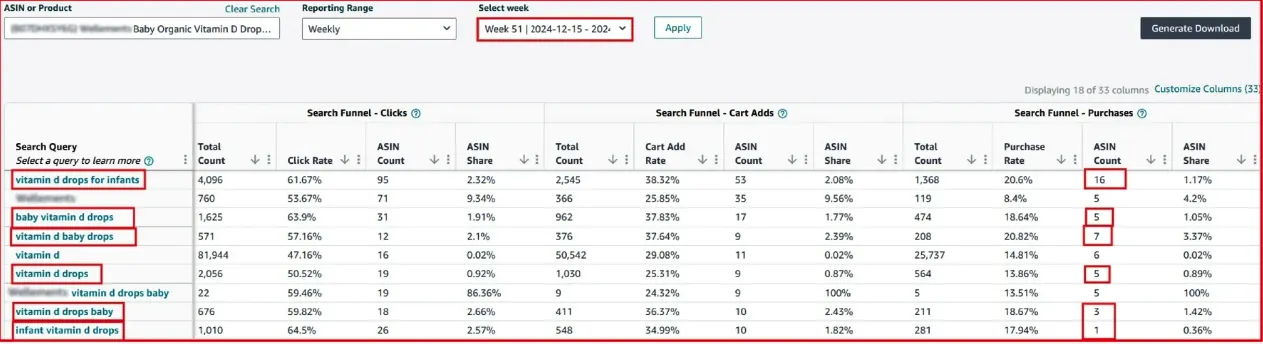
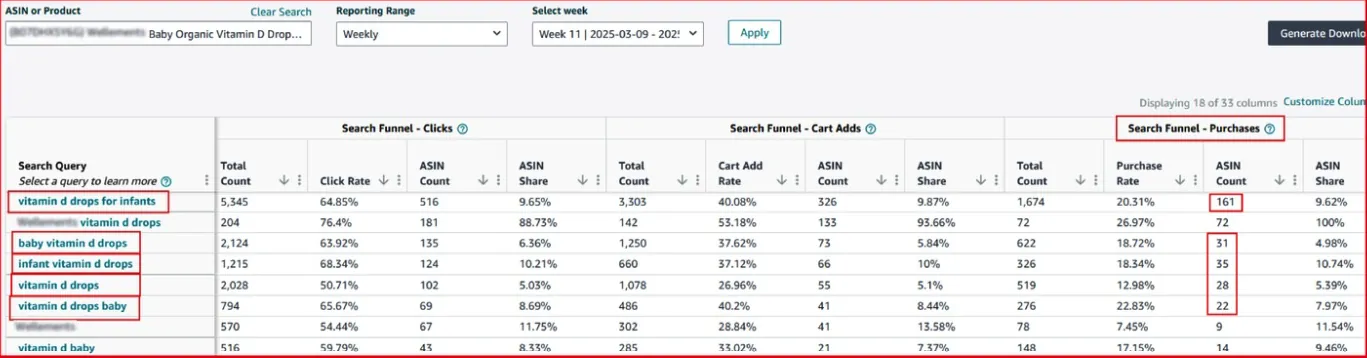
Revenue growth is easy to claim. Keyword-level purchase data is harder to fake. This is the Amazon Search Query Performance report for a baby vitamin D drops product, showing exactly how many purchases came from each keyword, week by week. In December, the brand was picking up 16 purchases a week from their biggest keyword. By May, it was 161. That's not an ACOS improvement. That's category dominance, built keyword by keyword.
Weekly Purchases (top KW)
16
↓
161
+906%
Purchase Share (top KW)
1.17%
↓
9.62%
+723%
Keyword Clicks (top KW)
95
↓
516
+443%
Monthly Est. Purchases
~64
↓
~644
10×
Keywords Performing
1
↓
5+
Growing
BEFOREAmazon Search Query Performance (SQP)
AFTERAmazon Search Query Performance (SQP)
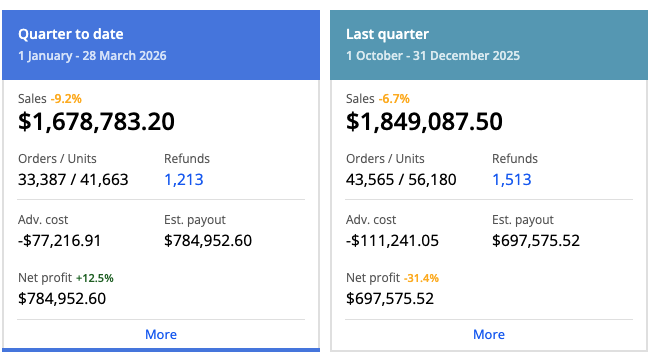
Client Asked to Increase Profitability. We Delivered $87K More and Reversed a Declining Trend.
This client came with one goal: increase profitability. Their numbers looked healthy on the surface, over $1.8M in quarterly sales, but the profit trend told a different story. Net profit was down 31.4% year-over-year in Q4. Ad spend was high, waste was buried in the campaigns, and every dollar of margin improvement required digging. We didn't just improve profitability. We reversed a declining trend and delivered more profit than the previous quarter, with less ad spend.
Net Profit
$697,575
↓
$784,952
+$87K
Profit Trend (YoY)
−31.4%
↓
+12.5%
+43.9pp
Ad Cost
$111,241
↓
$77,217
−30.6%
Ad Waste Saved
Buried
↓
$34K saved
Recovered
Sales Scale
$1.85M
↓
$1.68M QTD
Maintained
Real Account Data: Monthly Performance ChartSellerboard Profitability Dashboard: Q4 2025 vs Q1 2026
Left: Q1 2026 (Jan-Mar 28) Net profit +12.5% YoY | Right: Q4 2025 (Oct-Dec) Net profit was -31.4% YoY