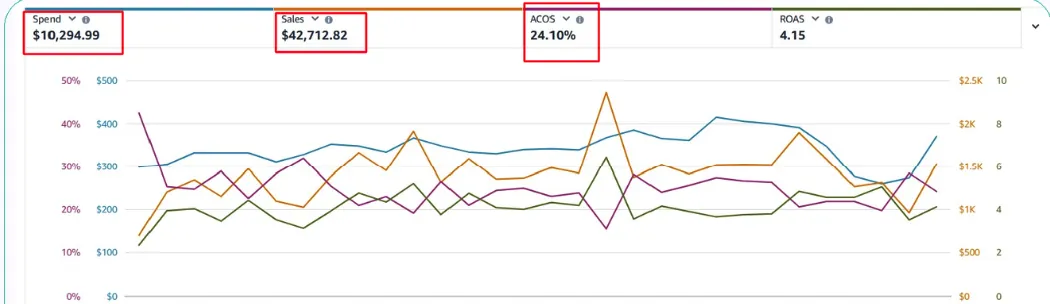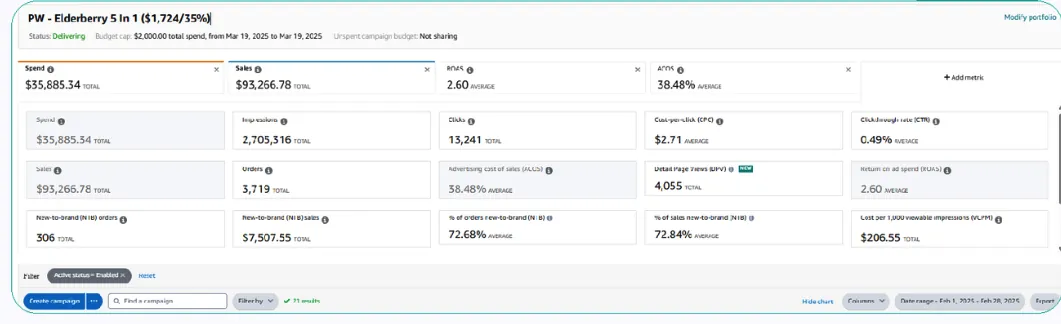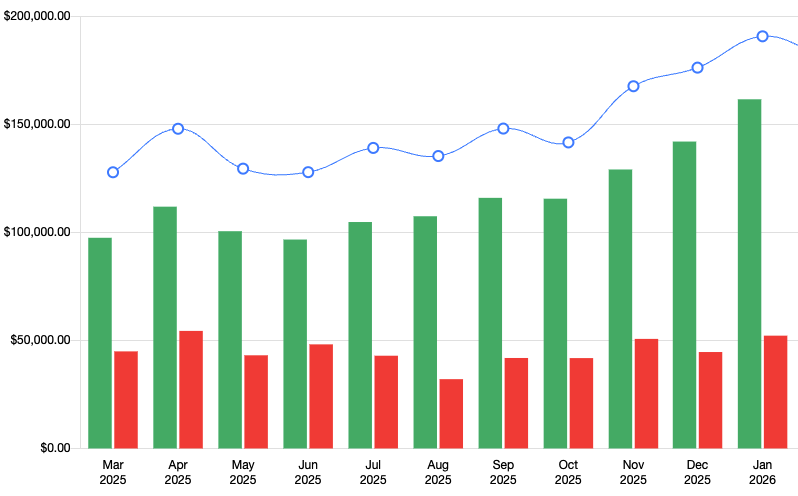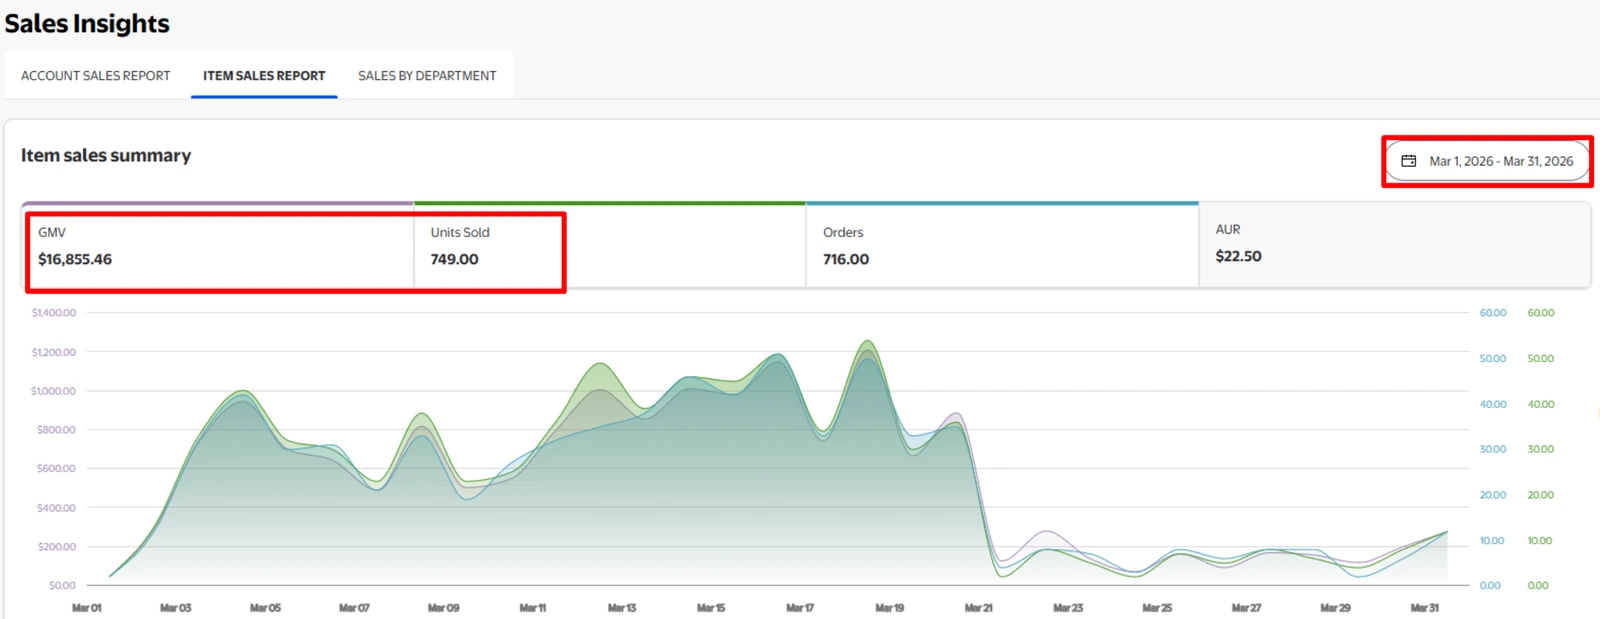
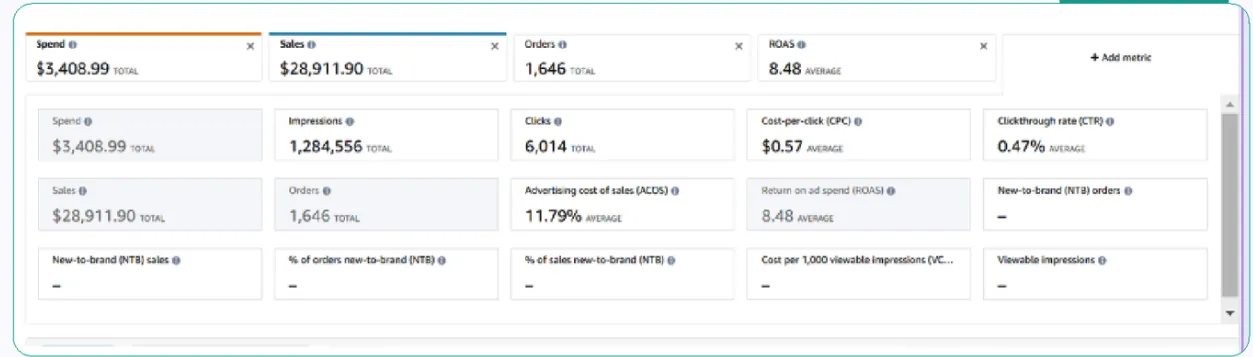
+102% Ad Sales · −53% ACOSListing-first PPC turnaround: sales doubled, ACOS cut in half
Redesigned the main image for click-through, rewrote listing copy and A+ Content to convert, then rebuilt Sponsored Products and daily bid management.
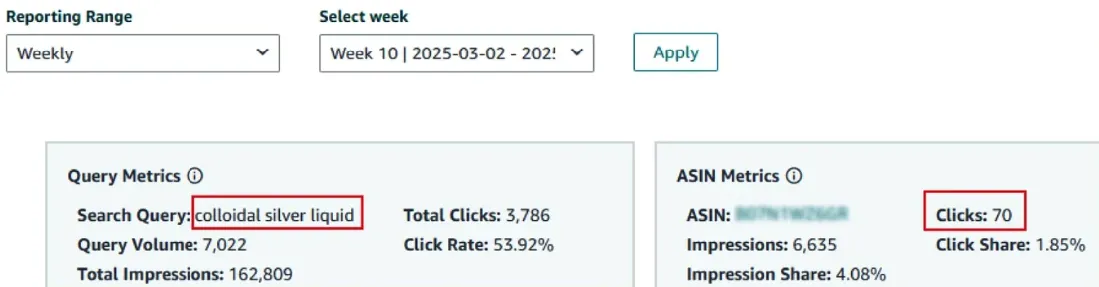
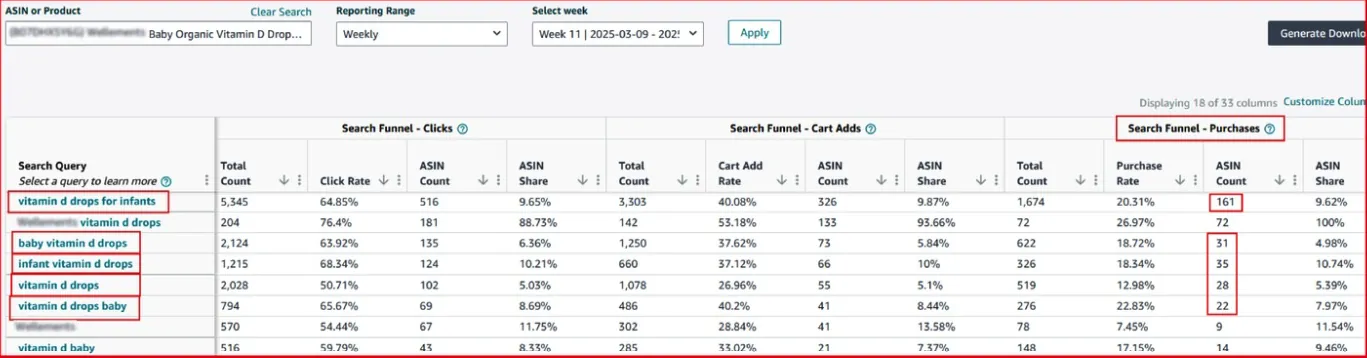
Search Query Performance is the closest thing Amazon gives you to a funnel for every search term. Most brands open it, see a wall of numbers and close it. Here’s how to read it one query at a time.
For each query, compare your share at each step: impressions, clicks, cart adds and purchases. Where your share drops between two steps tells you what to fix: visibility, the search result (image, price, reviews), the product page, or the offer itself.
| Column | What it means |
|---|---|
| Search query | The term shoppers typed |
| Search query volume | How many times it was searched in the period |
| Search query score | Amazon’s ranking of the query for your brand or ASIN |
| Total count | All brands’ impressions, clicks, cart adds or purchases for the query |
| Brand (or ASIN) count | Your share of those actions |
| Brand (or ASIN) share | Your count ÷ total count |
Use Brand View for the whole catalog and ASIN View for one product. Data is available by week, month and quarter. See Amazon’s Brand Analytics overview.
| Pattern | What it usually means | What to try |
|---|---|---|
| Low impression share | You barely show up for this query | Indexing, keyword coverage, Sponsored Products bids |
| Impression share fine, click share drops | Shoppers see you but pick others | Main image, price, review count and rating, title |
| Click share fine, cart add share drops | The page doesn’t persuade | Images, bullets, A+ Content, answering common questions |
| Cart adds fine, purchase share drops | Something stops checkout | Price vs competitors, delivery speed, coupons, stock |
| Share rises at every step | You’re winning this query | Protect it; consider more spend |
For large catalogs, the same data is available through the Selling Partner API for brands registered in Brand Registry, which makes it easy to track trends over months instead of exporting by hand. See our SP-API and Brand Analytics page.
We use Search Query Performance on every brand account to decide where listing work, SEO and PPC budget go, across Amazon marketplaces including the US, UK and Canada.
See how we work as an Amazon agency for Search Query Performance.
It’s a dashboard in Brand Analytics that lists the search queries that led shoppers to your products and shows impressions, clicks, cart adds and purchases for each one, both for all brands and for your brand.
Brand owners enrolled in Amazon Brand Registry with access to Brand Analytics. It’s in Brand Analytics under the Search Analytics menu.
Your brand’s count divided by the total count for that query at each stage. For example, if a query got 1,000 clicks and 80 were on your products, your click share is 8%.
Yes. Impressions and clicks in SQP come from search results and include both organic and sponsored placements, so it shows your total position on a query, not just ads.
SQP only counts purchases that came from search on those queries. Sales from other paths, such as external traffic or direct visits, aren’t included.
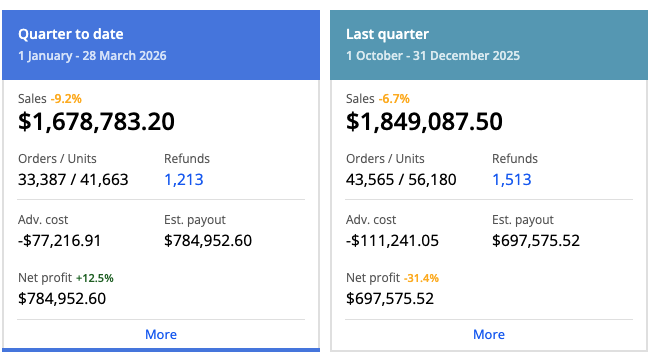
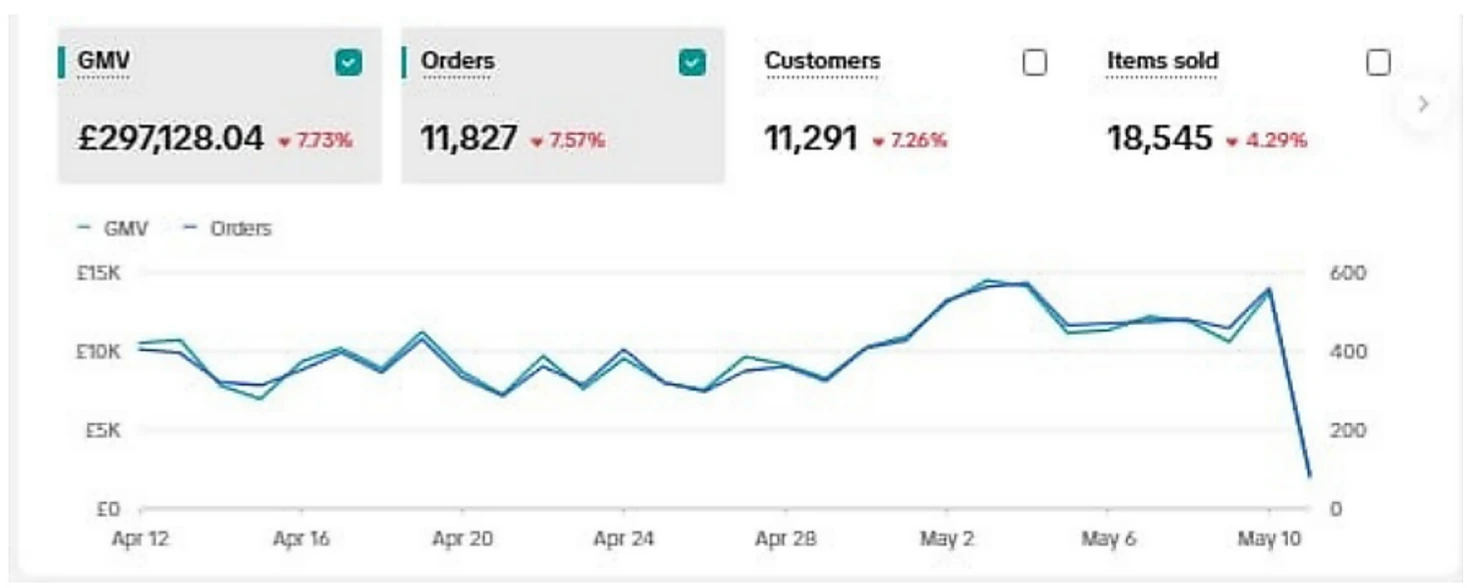
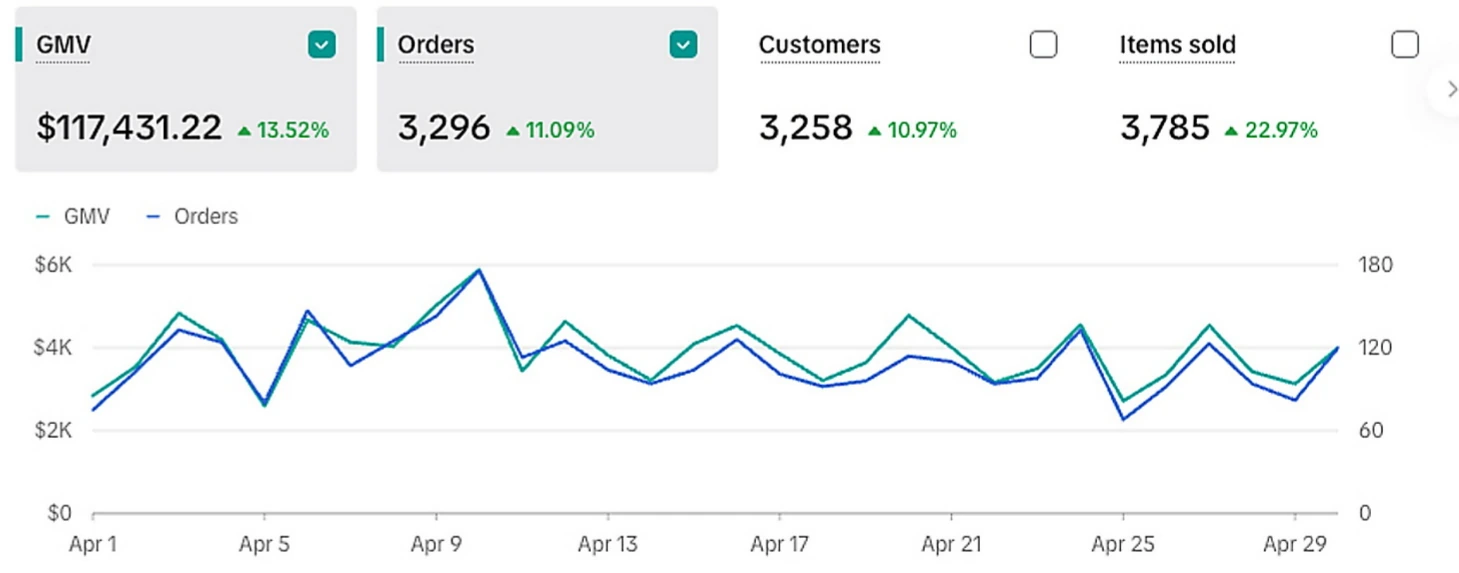
Every case study below comes directly from unedited Seller Central, Amazon Ads, Search Query Performance, Sellerboard, TikTok Shop, and Walmart Connect dashboards.
Read all 12 original written client reviews verbatim—linked directly to Trustpilot so you can verify every single one.
Book a strategy call. We’ll walk through your top queries and show where shoppers drop off.
Book a strategy callAmazon and TikTok Shop marketing agency for brand owners. 60+ brands managed in-house. Headquartered in Jacksonville, FL, USA.
Services